PobviEnce product · Microsoft Fabric · Power BI

Margin is set before the year starts.

PRYSMA: standard cost & margin planning for manufacturers, on Microsoft Fabric.

When resin, wages, tariffs or currency move, finance gets one question: what does it do to margin, product by product? PRYSMA models the cost drivers, compares scenarios and explains every dollar of margin change.

01Why it matters

Margin is set long before the year starts: in the standard cost.

The anchor

Everything rests on it

Pricing, quotes, margin targets and inventory values all rest on the standard cost.

The build

Bottom-up, from thousands of parts

It is built from thousands of bills of materials, run times, rates and material prices.

The question

What does it do to margin?

When resin, wages, tariffs or currency move, finance needs the answer product by product.

02Anatomy of a product's cost
Three parts, rolled up through every level.

  1. Materialsquantity × pricegrossed up for yield and scrap
  2. Conversionhours × ratessetup and run time × labor & overhead $/hr
  3. Dutiestariffson imported materials, switched on or off
  4. Standard costper unitrolled up through every BOM level, ÷ batch size
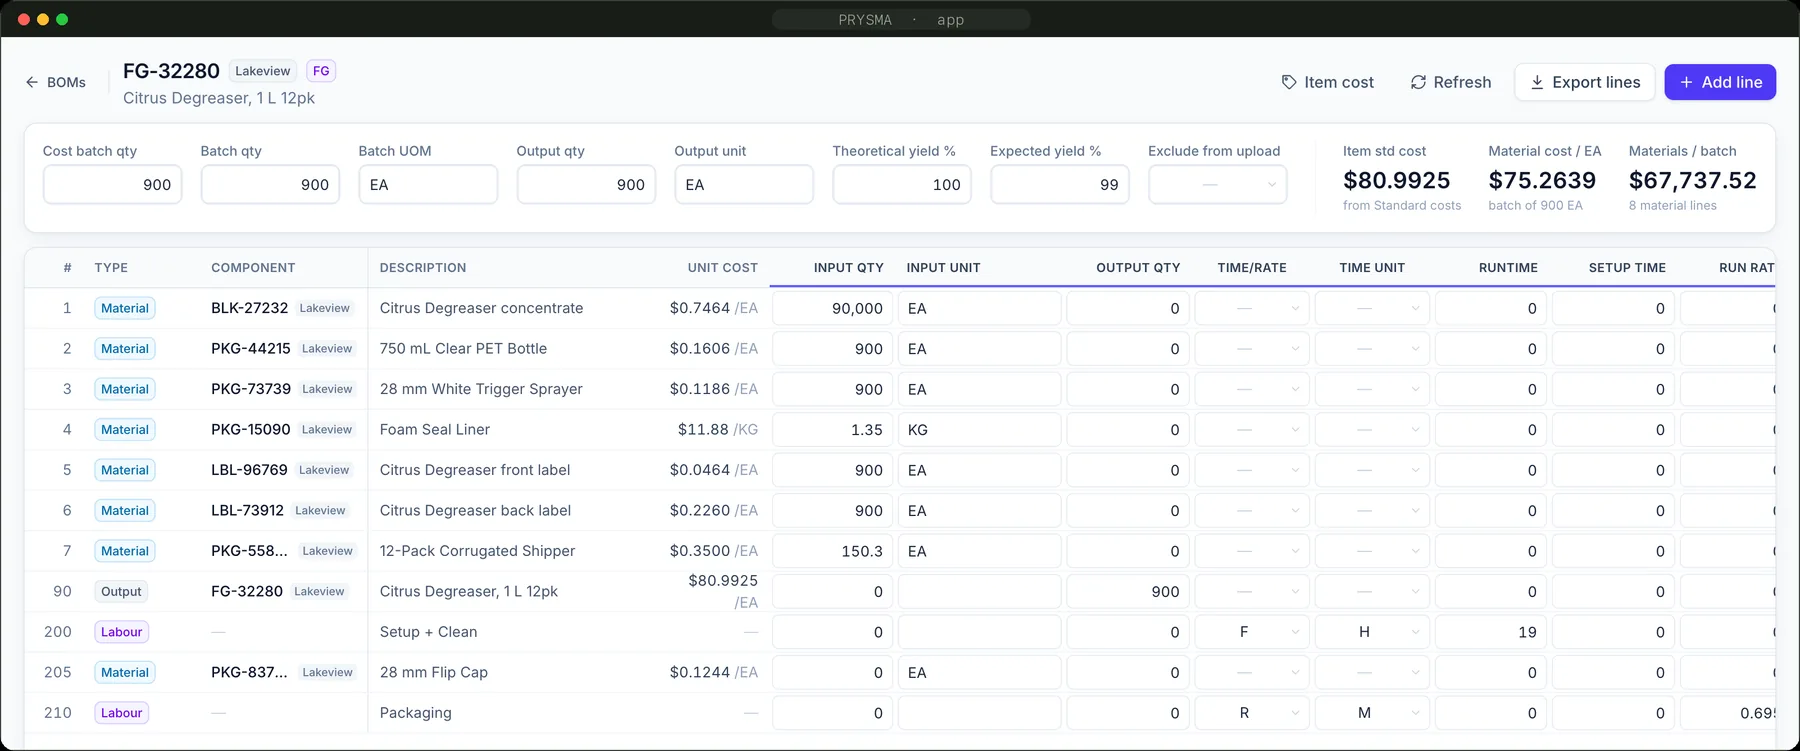
A finished good's bill of materials in PRYSMA: eight material lines, two labour activities, a batch of 900 at 99% expected yield, and a standard cost of $80.99 per unit.
One real bill of materials. 8 materials and 2 activities, a batch of 900 at 99% yield: $80.99 per unit. The concentrate on line 1 has a BOM of its own, one level down.

Six drivers

Six drivers move a product's cost. Each one is a question.

These are the questions finance gets asked every planning season. PRYSMA turns each one into a scenario.

  • Raw materialsWhat if resin rises 8%?01
  • ActivitiesWhat if the line runs 10% faster?02
  • Plant ratesWhat does a wage deal cost per SKU?03
  • Batch size & yieldWhat if we double the batch?04
  • Tariffs & dutiesWhat is our tariff exposure by SKU?05
  • CurrencyHow sensitive is margin to the euro?06

The problem

Setting standards in spreadsheets doesn't scale.

At a reference manufacturer, a single planning scenario holds 12,000+ item × plant costs and 1,850+ bills of materials, several levels deep, across 20 plants and warehouses.

  1. Ripple effectsOne material price moves every intermediate and finished good above it.
  2. Version chaosWhich file holds the current standard?
  3. No trailWho changed that rate, and when?
  4. Slow what-ifsEvery scenario takes days to rebuild.
  5. No explanationMargin moved, and nobody can say why.

03PRYSMA in one picture

Model. Compare. Explain.

01

Model

Plan the drivers, one scenario per draft.

  • Material costs & tariffs
  • Bills of materials
  • Rates by plant
02

Compare

Any scenario against any other.

  • Cost: prior → new
  • Sales: prior → new
  • By plant, family, product; tariffs on or off
03

Explain

Why margin moved, to the dollar.

  • Margin walk
  • Drill to one product
  • Movers, data checks, Excel export

A planning cycle, end to end.

Every draft is a scenario. Actuals stay untouched.

  1. 1Start from actualsCopy the current standard into a draft in seconds.
  2. 2Change the driversPurchasing sets material costs and tariffs; planners change BOMs, hours and yields; finance sets plant rates.
  3. 3RecalculateThe BOM explosion rolls every change up through every level.
  4. 4Compare & explainDraft against prior, cost against sales, product by product.
  5. 5Lock & publishWith the full change history.

RolesPurchasingPlant plannerAdminViewer

04Explain the margin

Every dollar of margin change, explained.

Prior year to the FY27 draft at one plant, on real data. Volume, price and each cost driver take their share, and the walk closes to the dollar.

Margin walk · prior year → FY27 draft · one plant$141,531,997+$32,072,813 margin

    One scale for every bar, starting at $100M, not at zero. Each driver starts where the previous one ended. Mint adds margin, coral takes it away.
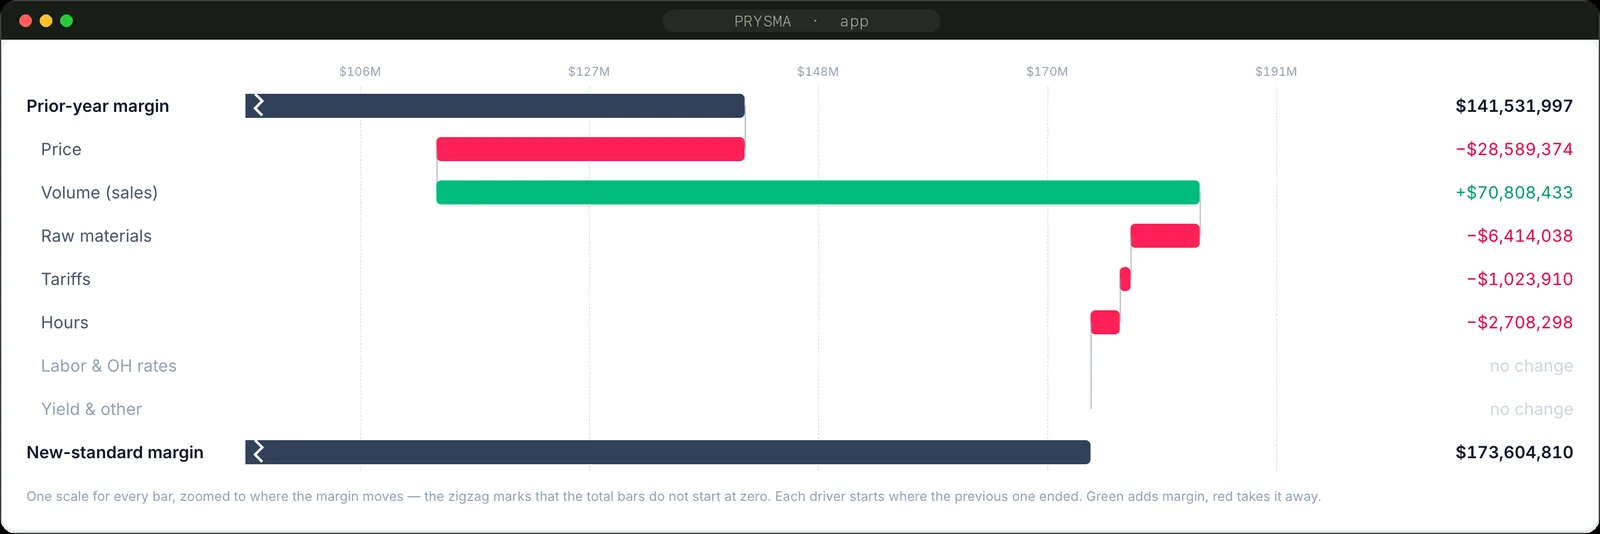
    • +$70.8MVolume
    • −$28.6MPrice
    • −$10.1MCost: materials $6.4M, hours $2.7M, tariffs $1.0M
    • +$32.1MMargin, end to end

    Compare

    Any cost scenario against any sales scenario.

    Keep sales still and you see the pure cost impact. Keep cost still and you see the pure commercial impact. Move both and you have the full plan. Try it.

    The PRYSMA compare bar: cost from Actual to FY27 Draft 1, sales from Sales 2025 to Sales 2027, plant Lakeview, all product families, tariffs on.
    The compare bar. Cost from actuals to the FY27 draft, sales from 2025 to 2027, by plant and product family, with tariffs on or off.
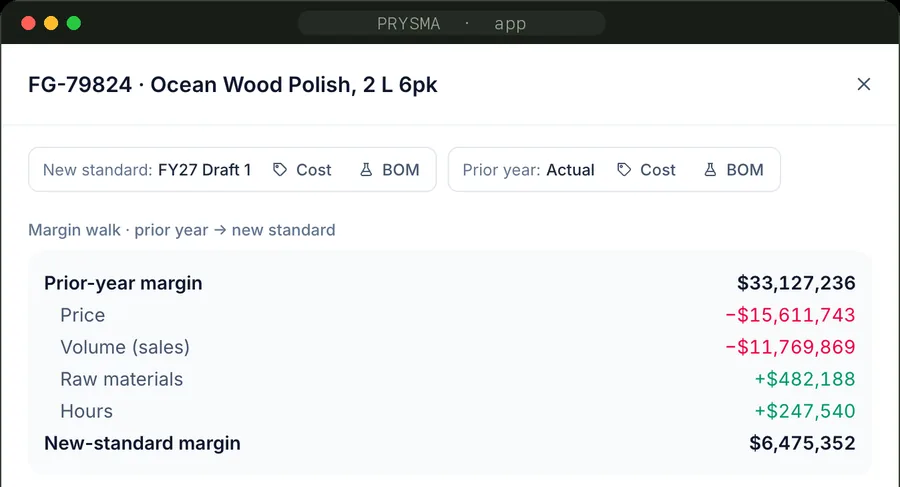
    One finished good drilled down in PRYSMA: its own margin walk from prior year to the new standard.

    Drill down to a single product.

    • The product's own margin walk
    • Cost of goods by element: materials, labor, overhead, tariffs
    • Materials by category, using your own categories
    • One click to its bill of materials and its costs

    05Built for the people who own the numbers
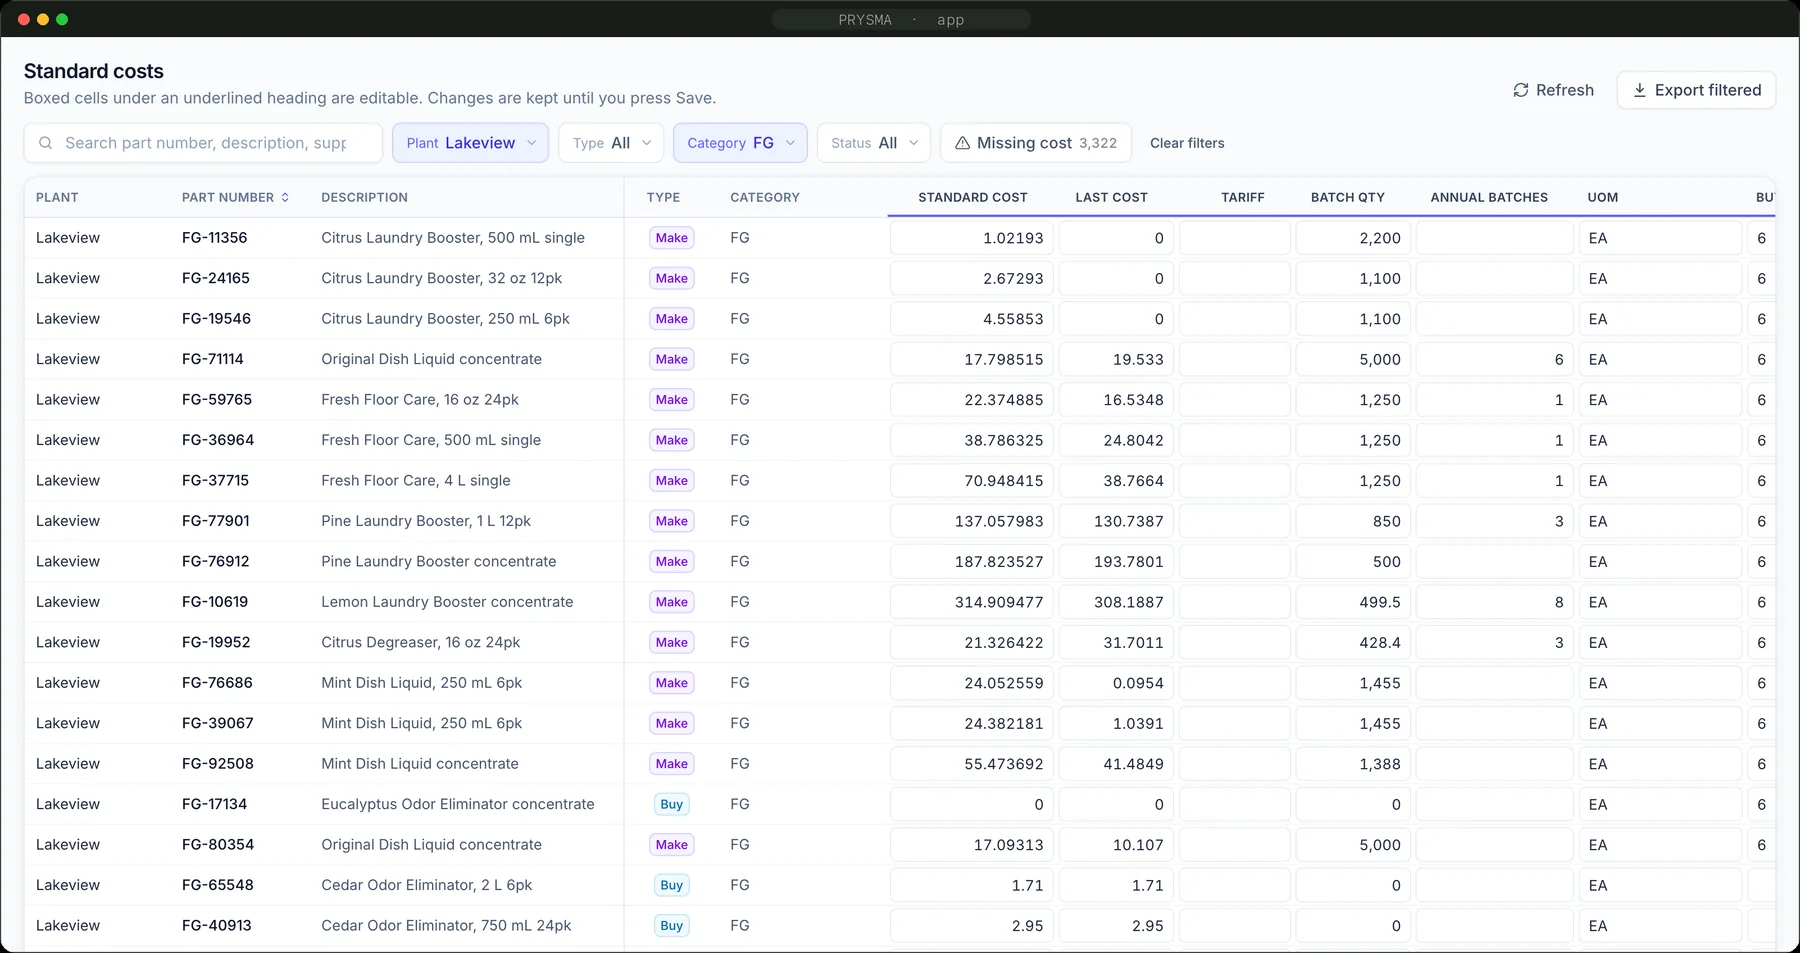
    Plan in a grid, not a spreadsheet.

    The PRYSMA standard costs grid, filtered to one plant and finished goods, with editable cells for standard cost, tariff, batch quantity and annual batches.
    • 01Spreadsheet-fast editing. Type into the grid, with validation as you go.
    • 02BOMs you can change. Add material or activity lines where the plan needs them.
    • 03Find anything. Filter by plant, type, category and status.
    • 04Every change recorded. Old value, new value, who and when, and exportable.

    Trust built in

    Checks before numbers travel.

    PRYSMA flags the changes that deserve a second look before a scenario is published, and controls who can change what.

    Data checks

    No cost in either scenarioCost doubled or halvedNegative marginNew cost with no priorVolume without net sales

    Controls

    Role presetsEdit rights per screen and plantLocked scenariosRead-only actualsField-level history
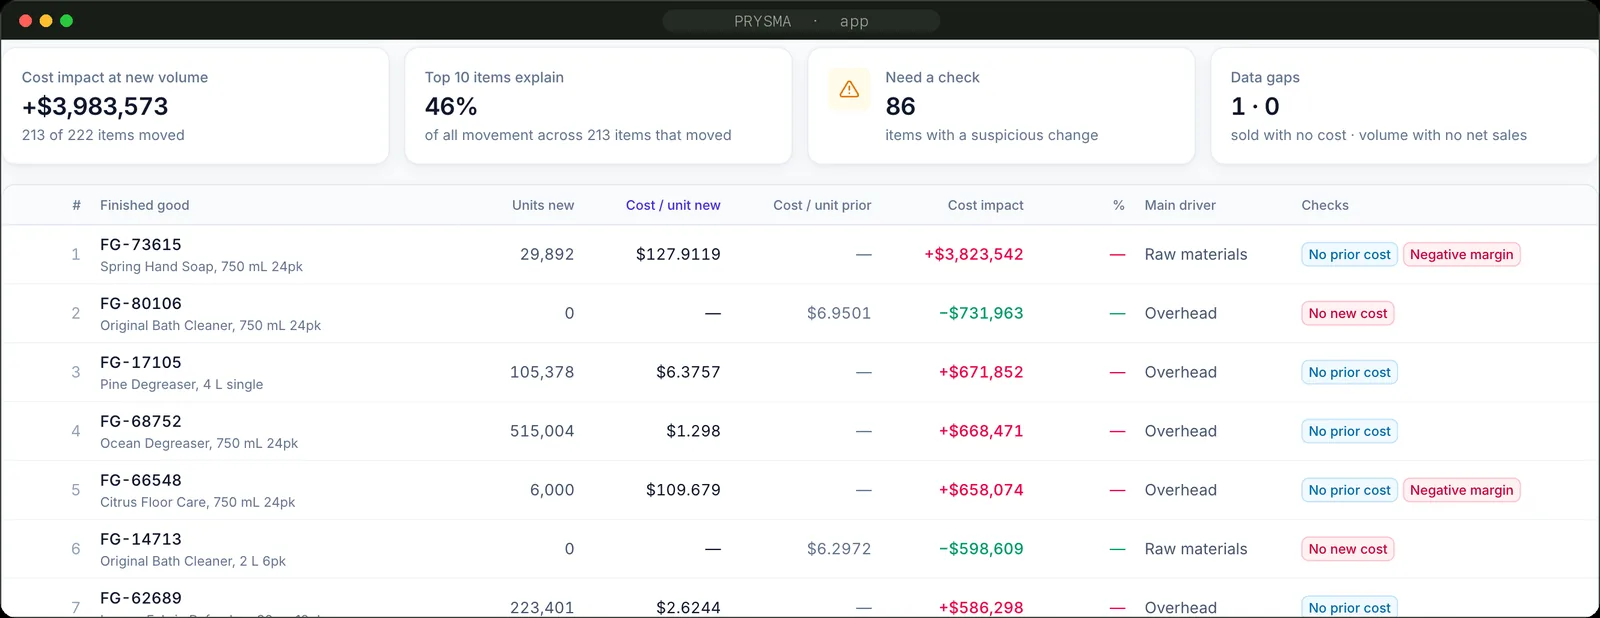
    PRYSMA's biggest movers: cost impact at new volume, the share explained by the top ten items, items that need a check, and per-item flags such as no prior cost and negative margin.
    Biggest movers, with the checks next to each one.
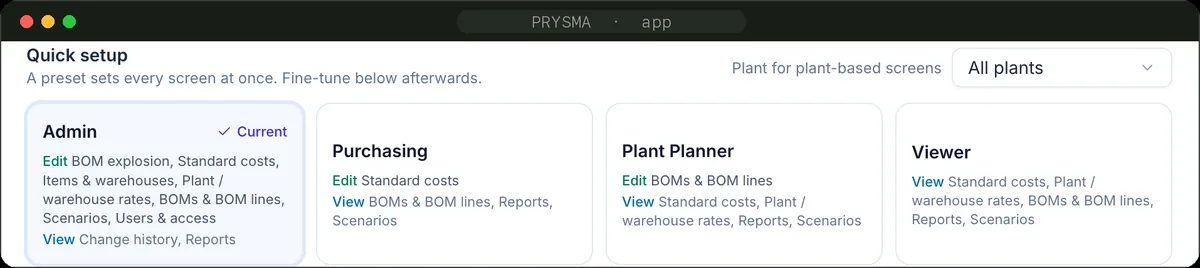
    PRYSMA role presets: Admin, Purchasing, Plant Planner and Viewer, each with its edit and view rights.
    Role presets set every screen at once.

    06Where it fits

    Where PRYSMA sits in your Microsoft data stack.

    Sources ERP / MRPPurchasingPlant financeCommercial plan
    Microsoft Fabric
    SQL databaseScenarios, costs, BOMs, rates, history
    BOM explosion engineMulti-level roll-up, per scenario
    Power BI semantic model150+ measures
    People PRYSMA appPlanners & adminsPower BIFinance & leadershipExcelOn the same model

    Your tenantRuns in your own Microsoft tenant, with Entra ID sign-in. One set of numbers.

    What ships: start from a working answer, not a blank canvas.

    1. A1

      Costing data model

      Scenarios, costs, BOMs, rates and history, in a SQL database in Fabric.

    2. A2

      BOM explosion engine

      Multi-level roll-up from materials and activities to every finished good.

    3. A3

      Margin semantic model

      A Power BI semantic model with 150+ measures, shared by the app, Power BI and Excel.

    4. A4

      Planning app

      Screens, reports, admin, roles and change history.

    What changes per manufacturerThe source mapping, the material categories and the costing rules.

    07Proof

    Live at a multi‑plant manufacturer.

    Per planning scenario, November 2026. The client's name is withheld.

    0item × plant standard costs
    0multi-level bills of materials
    0BOM lines
    0finished goods analysed for margin
    0plants & warehouses
    Secondsto copy a full scenario

    08Getting started

    What PRYSMA needs, and how a first scenario comes together.

    Five inputsItems & plantsBOMs & routingsMaterial costs & tariffsPlant ratesSales plan

    1. 1

      Connect

      Map your ERP/MRP, purchasing, plant finance and commercial plan.

    2. 2

      Baseline

      Load today's standard as read-only actuals.

    3. 3

      Reconcile

      Check PRYSMA's numbers against the ones you report today.

    4. 4

      Plan

      Copy the baseline into a draft and change the drivers.

    We make the complex obvious

    See PRYSMA on a live walkthrough.

    We're happy to walk you through PRYSMA whenever it's useful.