
Built for the questions you already knew
A report shows what someone decided to measure when it was built. The question you have today usually isn't on it.
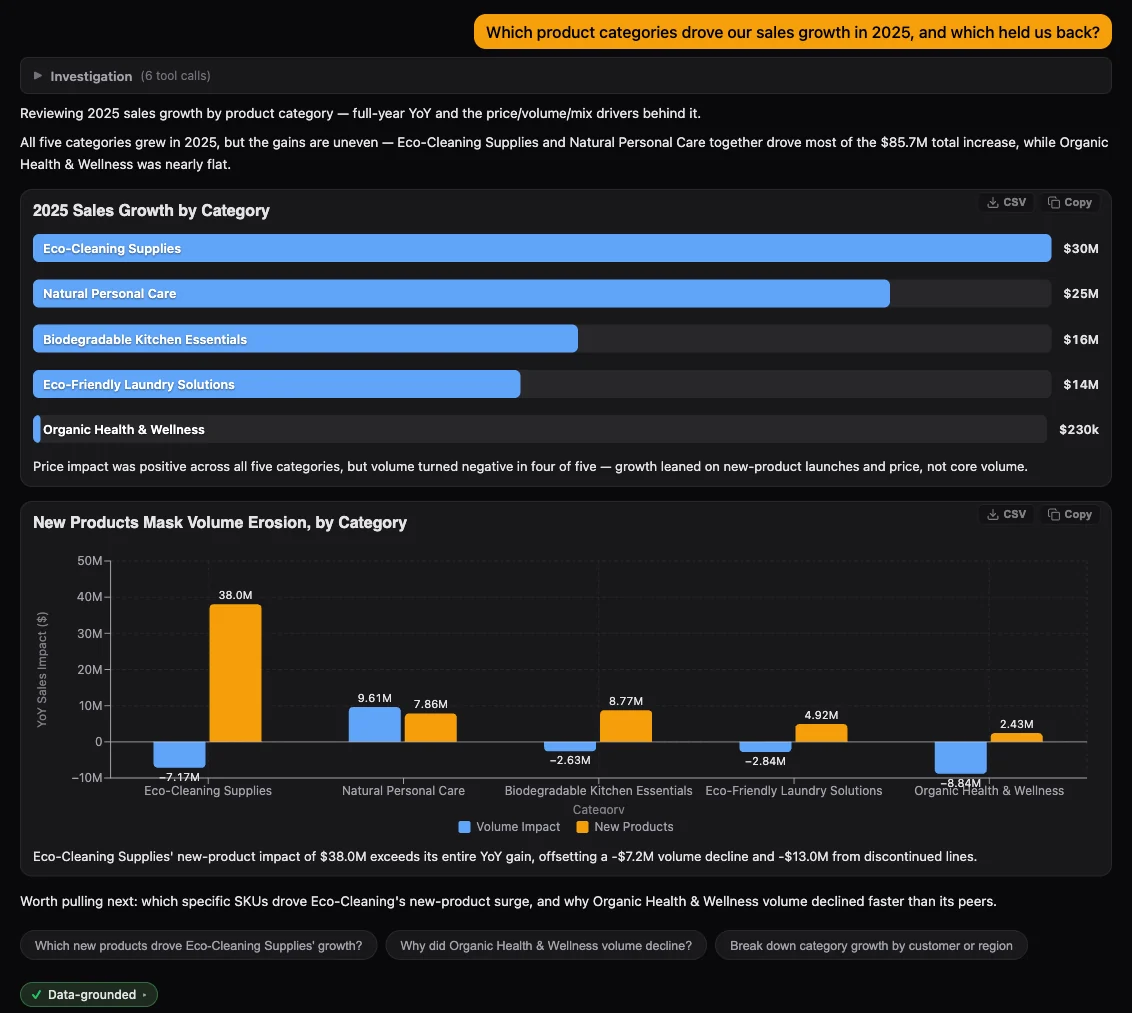
Dashboards answer the questions you already knew to ask. DataClaw answers the next one, in plain English, across your Power BI models, and checks the answer against the data with obviEnce's own validation technology.
The demo runs on sample sales data. Sign in with a code sent to your email.
01The problem
A report shows what someone decided to measure when it was built. The question you have today usually isn't on it.
A new page, a new export, or a wait for the analyst, while the moment passes.
Sales, finance and operations each have their own model and their own reports. The question that matters often needs more than one.
02How it works
Starts answering in secondsPower BIMicrosoft FabricMicrosoft sign-in
03Across your business
Your sales, finance and operations numbers live in separate Power BI models. DataClaw knows each one through its knowhow, picks the models a question needs, and brings the results together in one answer.
Why did margin fall in the West last quarter?
Margin in the West fell 2.1 points. Price held; higher returns in two product lines and a freight cost rise in finance explain most of the drop.
04Proprietary validation technology
DataClaw is built to give secure, consistent, accurate answers, and to tell you when it can't verify one. The check is obviEnce's own proprietary technology: an independent review of the answer against the rows it was built from. A general AI assistant answers confidently, but often can't show where a number came from. DataClaw can.
South doesn't match the data. DataClaw revises that section once and checks it again. If it still doesn't match, the section is removed or flagged, and the badge says so.
1 issue found · see report Illustrative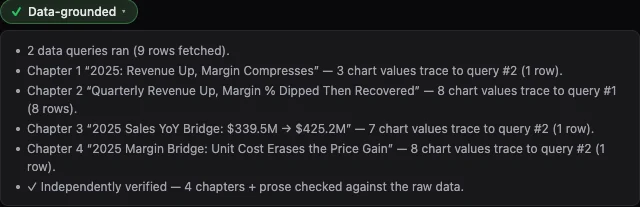
We work hard to earn your trust.
05Insight, not a dashboard
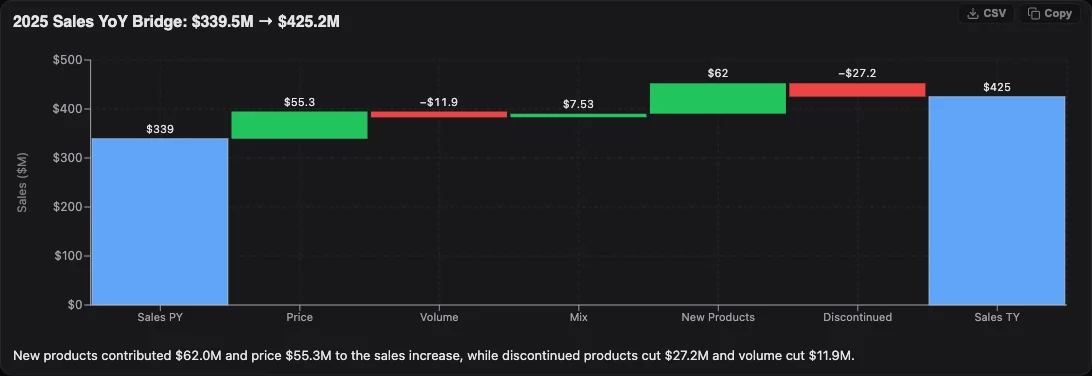
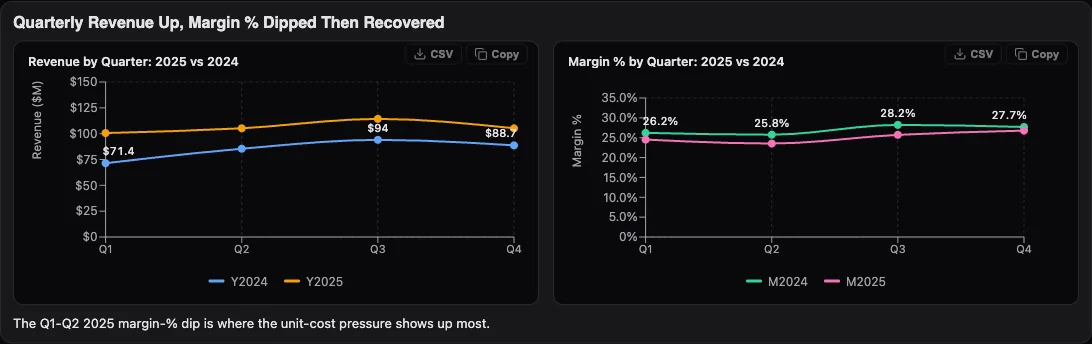
DataClaw surfaces the one to three things that matter, explains what they imply, and suggests what to look at next. Restyle a chart by asking, copy it as an image, or export its data.
06Your expertise, built in
DataClaw reads your company's own definitions: which measures are the governed ones, what your terms mean, and the traps to avoid in your data. We call each one a knowhow.
A knowhow describes a business area: its measures, its terms and its known traps. It holds meaning, not your data.
A first draft can be drawn from your live Power BI model, then refined by the people who know the business.
Your company owns its knowhows and edits them in an admin editor, with full revision history.
07Secure by design
DataClaw doesn't add a second set of data permissions to maintain. It works inside the security you already have in Power BI.
08What you get
DataClaw works with the semantic models you already have in Microsoft Fabric and Power BI. No separate warehouse, and no second set of data permissions to maintain.
We make the complex obvious
Try DataClaw on sample sales data, or let us walk you through it on yours.